Real-time user insightsExperience-driven IT managementEmbedding XLAs into daily operations
Identifying Digital Friction. Improving Experience. Protecting Productivity. Unlocking Value.
Reducing Friction Drives Business Value. This is how we do that...
We help organizations make digital friction visible, measurable and economically relevant. Through our Digital Friction Compass™, we combine targeted employee feedback with existing technical and operational data to identify where work becomes harder than it should be — and what that friction truly costs. The result is a clear Friction Index, quantified impact insights and focused improvement priorities. Not another monitoring tool, but a structured approach to continuously reduce friction, restore flow and strengthen business performance.
Digital Friction Compass™
Measure. Improve. Elevate Experience.
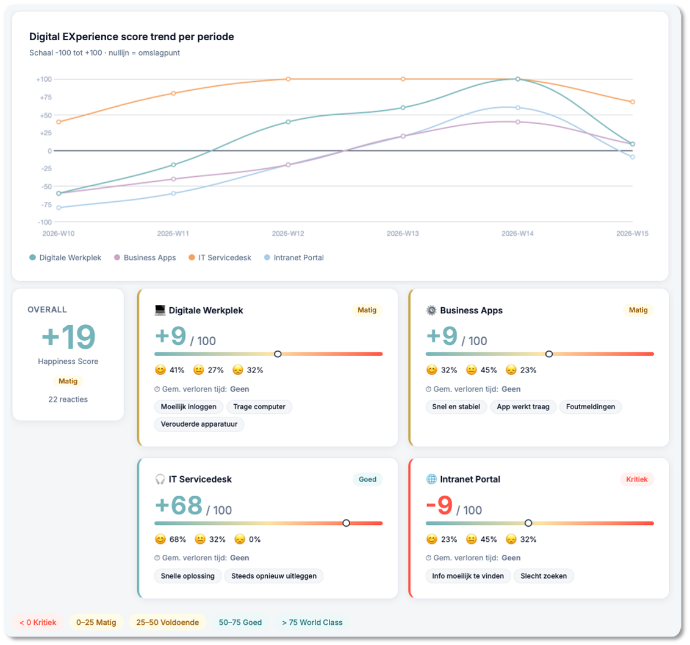
Reducing digital friction is not about measuring satisfaction — it is about restoring flow in daily work. Small disruptions, inefficient handovers and unstable tools silently erode productivity and focus, even when traditional metrics appear healthy. Our Digital Friction Compass™ makes this hidden friction visible. By combining employee feedback with technical and operational data, it measures friction across your digital environment.
This creates a clear Friction Index showing where work slows down, who is affected and where improvement delivers the greatest impact — enabling organizations to continuously reduce friction and strengthen business performance.
Friction Calculator
Translating Friction into Economic Impact
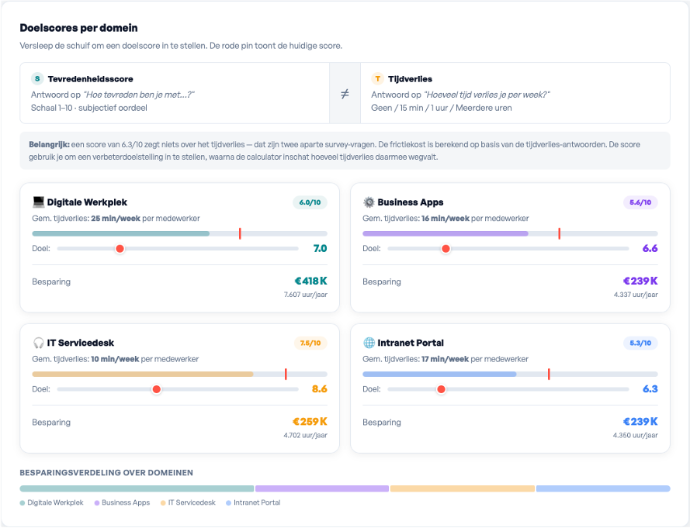
Reducing digital friction improves experience — but leadership needs to understand the financial impact. Our Friction Value Calculator translates friction into measurable business value. By combining reported time loss, workflow inefficiencies and operational data with realistic productivity benchmarks, it quantifies how digital friction affects performance, support costs and Return On IT Experience investments. (ROX) Instead of assumptions, you gain clear insight into how much productivity is lost over time, which friction drivers create the highest cost, and where improvements will generate the strongest return.
The Friction Value Calculator does not promise savings — it provides decision-ready insights and defensible business cases for smarter, prioritized investment.
Approach: How We Solve Digital Friction
Reducing Digital Friction, Step by Step
Digital friction rarely has a single cause. It emerges where technology, processes, support and daily work intersect. Our approach focuses on making that friction visible, quantifying its impact and driving targeted improvements where they create measurable value. We do not start with frameworks or contracts — we start with friction.
Step 1. Identifying Where Friction Occurs
We begin by establishing a clear view of how digital work is actually experienced.
Through focused diagnostics, targeted feedback and analysis of existing operational data, we identify where work slows down, where effort increases and where trust erodes. This reveals which teams, services or processes are most affected — and where friction concentrates.
The outcome is a first friction baseline and priority map.
Step 2. Measuring Friction with the Digital Friction Compass
Next, we structure and quantify what we see. The Digital Friction Compass brings together:
- Technical signals (performance, stability, availability)
- Process signals (handoffs, rework, ticket patterns)
- Experiential signals (effort, interruption, loss of flow)
These are consolidated into a clear Friction Index, making friction measurable across teams, services and locations. This transforms scattered signals into actionable insight.
Step 3. Quantifying Business Impact: our Friction Calculator
Reducing friction is not only about improving experience — it is about protecting productivity. Using our Friction Calculator, we translate friction signals into indicative economic impact by combining time loss patterns, usage data and productivity benchmarks.
This helps management understand where value leaks occur, which friction drivers carry the highest cost, where improvement will deliver the strongest return and which improvement priorities become economically defensible.
Step 4. Driving Continuous Friction Reduction
Insight alone does not reduce friction. Action does. That's why we support organizations in implementing targeted improvements — whether in user interface design, process adjustments, support interactions or communication practices.
Use the Digital Friction Compass as a continuous measurement subscription, enabling trend monitoring and structured feedback loops without survey overload or heavy platform investments.
By embedding friction awareness into operational routines, digital experience management becomes a practical, ongoing discipline — continuously restoring flow, productivity and trust.
Need help reducing digital friction and unlocking measurable value?
Let us help you make digital friction visible, quantify its impact and turn insight into targeted improvements. With the Digital Friction Compass™ and ROX Calculator™, we translate everyday friction into clear priorities and defensible business impact — restoring flow, productivity and trust in your digital environment.
What you will get
Clear Digital Friction insight
A measurable Friction Index
Quantified business impact (€)
Contact usHow do we reduce digital friction?
By combining targeted employee feedback with technical and operational data, we make digital friction visible and measurable. The Digital Friction Compass™ reveals where work slows down, where effort increases and where value leaks occur — turning scattered signals into clear improvement priorities.
Why BePresent?
With over 25 years of ITSM and change expertise, we understand how technology, processes and human behavior interact in daily work. We do not add another monitoring tool — we provide structured friction insight and practical guidance that translates experience into measurable business impact.
What sets us apart?
We focus on friction — not satisfaction scores. By connecting technical signals, process patterns and experiential data, we expose hidden productivity loss and quantify its impact through our ROX approach. This allows organizations to prioritize improvements based on real economic value, not assumptions.